


Semiconductors have long been a crucial component of the tech industry, serving as the backbone for a wide array of electronic devices and systems. The recent trend in the semiconductor market, however, has raised concerns among investors and analysts alike. A pattern known as the head and shoulders top has emerged, signaling a potential reversal in the market.
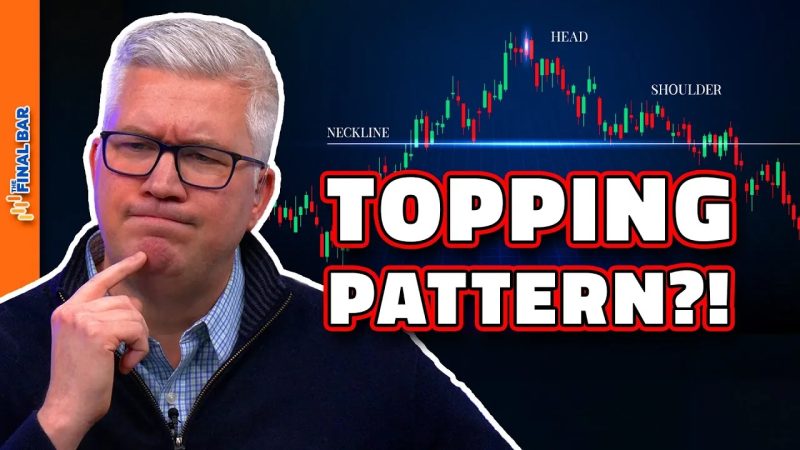
The head and shoulders top pattern is a technical analysis chart pattern that indicates a potential reversal of an uptrend. It is formed by three peaks: a higher peak (the left shoulder), the highest peak (the head), and a lower peak (the right shoulder). The pattern is completed when the price falls below the neckline, a trendline connecting the low points of the left and right shoulders.
In the semiconductor industry, the emergence of a head and shoulders top pattern can have significant implications for investors and market observers. It suggests that the uptrend in semiconductor stocks may be losing momentum and that a downtrend could be on the horizon. This pattern is often seen as a bearish signal, prompting investors to consider reducing their exposure to semiconductor stocks or even taking short positions.
One key factor contributing to the head and shoulders top pattern in the semiconductor sector is the cyclical nature of the industry. Semiconductor demand is closely tied to global economic trends, with periods of high demand often followed by downturns as the market adjusts to changing conditions. The emergence of new technologies, geopolitical factors, and supply chain disruptions can all impact semiconductor stocks and contribute to the formation of chart patterns like the head and shoulders top.
Investors and analysts closely monitor technical analysis patterns like the head and shoulders top in the semiconductor industry to gain insights into market trends and potential investment opportunities. While chart patterns are not foolproof indicators of future price movements, they can provide valuable information when combined with other forms of analysis.
In conclusion, the head and shoulders top pattern in the semiconductor industry is a significant development that investors and market participants should be mindful of. It highlights the potential for a trend reversal and prompts careful consideration of investment decisions in semiconductor stocks. By staying informed about technical analysis patterns and market dynamics, investors can navigate the ever-changing semiconductor landscape with greater confidence and strategic foresight.