


Navigating the Uncertainty: A Guide to Making Informed Decisions in the Summer Market
Understanding market trends is key to making wise investment decisions. As we enter the summer season, investors often face increased uncertainty and volatility. However, by utilizing the right tools and strategies, it is possible to navigate through market tops and make informed choices.
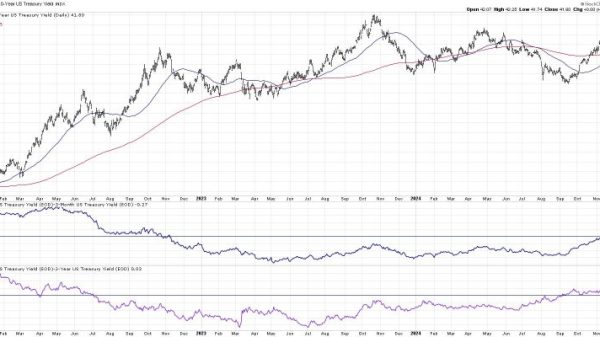
One such tool that can be instrumental in guiding investors during uncertain times is the market chart. A market chart visually represents the movement of stock prices over a specific period, providing valuable insights into trends and patterns. By analyzing the chart, investors can identify potential opportunities and risks in the market.
The first step in using a market chart effectively is understanding the different elements that make up the chart. These elements include the price axis, which represents the price of the security being analyzed, and the time axis, which shows the timeline of the chart. Additionally, the chart may include various indicators such as moving averages, trendlines, and volume bars, all of which can help investors interpret the data more accurately.
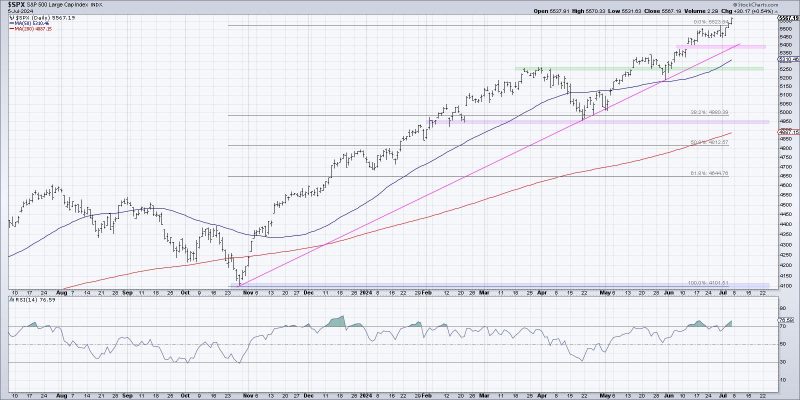
When analyzing a market chart, investors should pay close attention to key patterns and signals that may indicate a potential market top. One common pattern that investors look for is a divergence between the price of a security and key technical indicators. If the price of a security continues to rise while technical indicators show signs of weakness, it may be a signal that a market top is nearing.
Another important signal to watch for is a change in trading volume. A significant increase in trading volume, especially during a downward price movement, can indicate that large institutional investors are selling off their positions, which could lead to a market top. Conversely, a decrease in trading volume during a price rally may signal that the market is losing momentum.
In addition to analyzing market charts, investors can also use fundamental analysis to make informed decisions during a summer market top. Fundamental analysis involves evaluating the financial health and performance of a company, including factors such as revenue growth, profitability, and market share. By understanding the underlying fundamentals of a company, investors can better assess its long-term potential and make more informed investment decisions.
Finally, it is important for investors to stay informed and be prepared to adapt to changing market conditions. By regularly monitoring market charts, staying up to date on market news, and consulting with financial advisors, investors can navigate summer market tops with confidence and make informed decisions that align with their investment goals.
In conclusion, navigating a summer market top requires a combination of technical analysis, fundamental analysis, and staying informed about market developments. By utilizing tools such as market charts and paying close attention to key signals and patterns, investors can make informed decisions and stay ahead of market trends. Remember, the key to successful investing lies in staying informed, remaining disciplined, and being prepared to adapt to changing market conditions.