


In trading, having a competitive edge is crucial to achieve success in the financial markets. Traders are always looking for ways to improve their edge and increase their chances of making profitable trades. There are numerous indicators and tools available that traders can use to enhance their trading strategy, but not all indicators are equally effective. In this article, we will discuss two key indicators that can help traders improve their edge and make more informed trading decisions.
1. Relative Strength Index (RSI):
The Relative Strength Index (RSI) is a popular momentum oscillator that measures the speed and change of price movements. The RSI is calculated using the average gains and losses over a specified period, usually 14 days. The RSI ranges from 0 to 100 and is typically used to identify overbought and oversold conditions in the market.
Traders can use the RSI to determine potential trend reversals or continuation patterns. An RSI reading above 70 indicates that a stock is overbought, suggesting a potential pullback in price. Conversely, an RSI reading below 30 indicates that a stock is oversold, signaling a possible reversal to the upside.
By incorporating the RSI into their analysis, traders can better time their entry and exit points and avoid trading against the prevailing trend. The RSI can help traders filter out false signals and identify high-probability trading opportunities, giving them a competitive edge in the market.
2. Moving Averages:
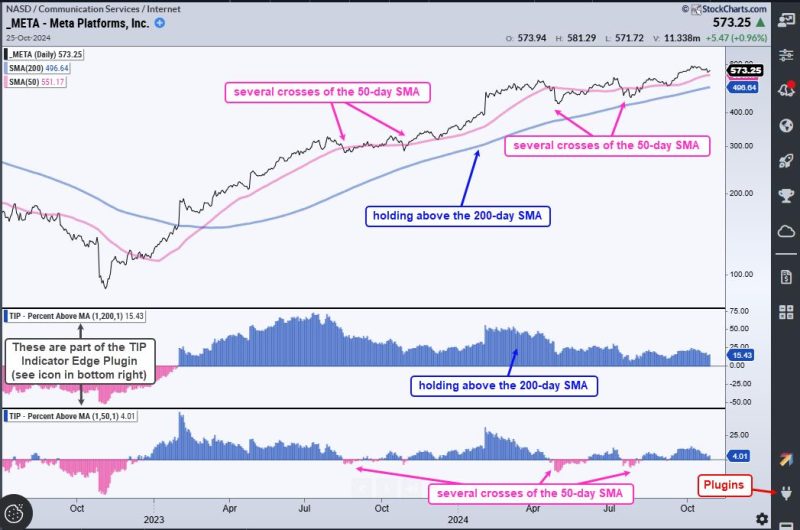
Moving averages are another essential tool that traders can use to improve their edge in trading. Moving averages smooth out price data to identify trends and momentum in the market. The two most commonly used moving averages are the simple moving average (SMA) and the exponential moving average (EMA).
Traders often use moving averages to identify trend reversals and confirm the direction of the trend. When the shorter-term moving average crosses above the longer-term moving average, it is considered a bullish signal, indicating a potential uptrend. Conversely, when the shorter-term moving average crosses below the longer-term moving average, it is a bearish signal, suggesting a possible downtrend.
By paying attention to moving average crossovers and the relationship between various moving averages, traders can make more informed trading decisions and increase their chances of success in the market. Moving averages can act as dynamic support and resistance levels, helping traders identify key turning points in the market and capitalize on profitable trading opportunities.
In conclusion, by incorporating indicators such as the Relative Strength Index (RSI) and moving averages into their trading strategy, traders can improve their edge and achieve better trading results. These indicators can help traders identify potential trend reversals, filter out false signals, and confirm the direction of the trend, giving them a competitive advantage in the market. By combining these indicators with sound risk management practices and a disciplined trading approach, traders can enhance their trading performance and increase their profitability over time.