


In the world of investing, the retail sector has always been an area of interest due to its direct connection to consumer behavior and economic trends. One ETF that tracks the performance of the retail sector is the SPDR S&P Retail ETF (XRT). Investors often look towards technical analysis to gauge the potential future movements of such ETFs. In the case of XRT, recent chart patterns and trends are indicating a nuanced outlook.
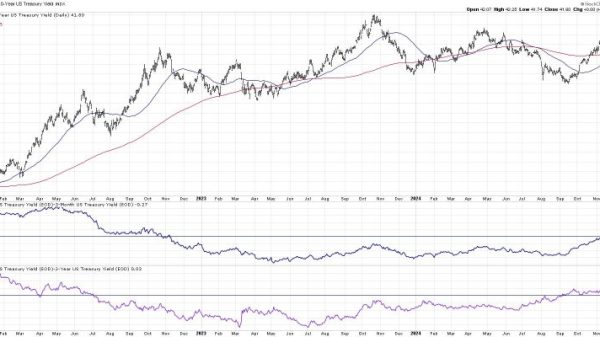
The chart analysis of XRT shows some interesting patterns that may hint at future price movements. One noticeable pattern is the formation of a descending triangle, which typically signals a potential bearish trend. This pattern is formed by a series of lower highs while the support level remains relatively flat. A break below the support level could indicate a further decline in the price of XRT.
On the other hand, the Relative Strength Index (RSI) for XRT is currently hovering around the oversold territory. This could indicate that the ETF is reaching a point where it may be considered undervalued, potentially leading to a reversal in the downtrend. Additionally, the Moving Average Convergence Divergence (MACD) indicator is showing signs of a possible bullish crossover, further supporting the idea of a potential turnaround in the price of XRT.
However, it is crucial for investors to consider the broader economic and market conditions when interpreting chart patterns and indicators. The retail sector is heavily influenced by consumer sentiment, economic growth, and market trends. Factors like consumer spending, online retail competition, and overall market volatility can all impact the performance of retail ETFs like XRT.
It is also worth noting that technical analysis is just one tool in the investor’s toolkit and should be used in conjunction with fundamental analysis and market research. While chart patterns and indicators can provide valuable insights into potential price movements, they are not foolproof and should be used with caution.
In conclusion, the charts for XRT are showing mixed signals, with some indicators pointing towards a potential downturn while others suggest a possible reversal. Investors should closely monitor both technical and fundamental factors to make informed decisions about the future performance of the SPDR S&P Retail ETF.