


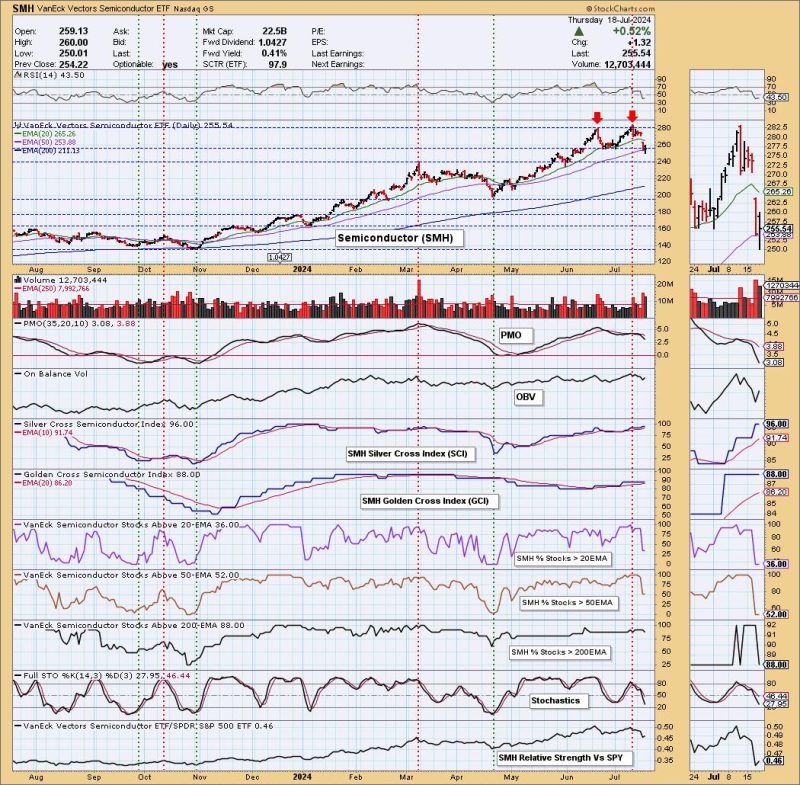
The recent observation of a double top pattern on the semiconductors industry, as represented by the Semiconductor ETF (SMH), has garnered keen attention from investors and market analysts alike. The double top pattern is a technical analysis formation that indicates a potential trend reversal in the market. This pattern is characterized by two consecutive peaks at a similar price level, followed by a decline in the asset’s value.
In the context of the Semiconductor ETF (SMH), the double top formation suggests that the industry may be reaching a point of exhaustion in its upward momentum. The first peak represents a significant resistance level that the asset failed to surpass, leading to a subsequent decline in price. Following this decline, the asset made a second attempt to reach the resistance level but was unable to do so, forming the second peak. This failure to break through the resistance level on two occasions is seen as a bearish signal by technical analysts.
The implications of the double top pattern on the semiconductors industry are significant for investors and traders looking to make informed decisions in the market. The pattern suggests that the bullish trend that had been driving the industry’s performance may be losing momentum, potentially leading to a reversal in the near future. Investors who are long on the Semiconductor ETF (SMH) may consider tightening their stop-loss levels or taking profits to protect their gains in light of this formation.
Traders who actively participate in the market may also view the double top pattern as an opportunity to take short positions on the Semiconductor ETF (SMH) in anticipation of a downward trend. By identifying the resistance level that has twice prevented the asset from advancing further, traders can set stop-loss orders above this level to manage their risk effectively. Additionally, technical indicators such as the Relative Strength Index (RSI) and Moving Averages can be used to confirm the validity of the pattern and gauge the strength of the potential reversal.
It is essential for market participants to exercise caution and conduct thorough analysis before making trading decisions based on technical patterns such as the double top formation. While these patterns can provide valuable insights into market trends and potential reversals, they are not foolproof indicators and should be used in conjunction with other forms of analysis. By staying informed and remaining adaptable to changing market conditions, investors can navigate the complexities of the market with greater confidence and effectiveness.