


The S&P 500 index has long been regarded as a barometer of the overall health and performance of the stock market. Investors and analysts keenly watch the movements of the S&P 500 as it represents a broad spectrum of companies and industries in the United States. Recently, there have been several major topping signals that have been flashing in the S&P 500, indicating a potential shift in market sentiment and direction.
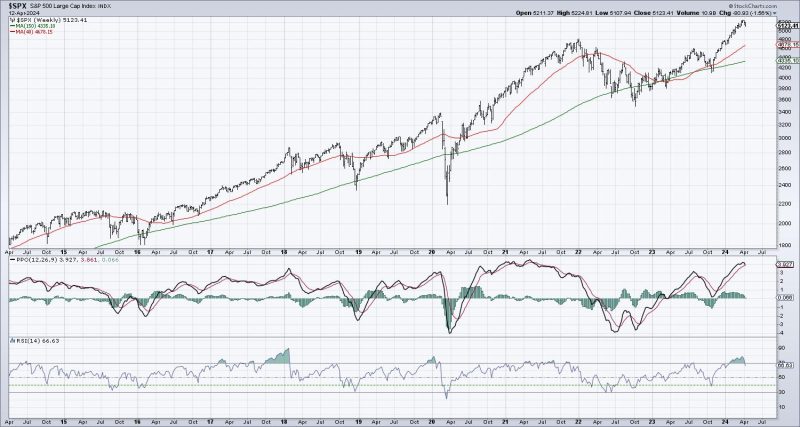
One of the key indicators signaling a potential market top is the bearish divergence in the Relative Strength Index (RSI). The RSI is a momentum oscillator that measures the speed and change of price movements. When the price of the S&P 500 continues to rise but the RSI fails to confirm these higher highs, it suggests weakening momentum and a possible impending reversal in the market. This bearish divergence in the RSI can be a crucial warning sign to investors to exercise caution and consider adjusting their investment strategies.
Another significant indicator flashing a major topping signal in the S&P 500 is the presence of a potential double top pattern on the price chart. A double top pattern is a technical chart pattern that occurs when the price of an asset makes two consecutive peaks at a similar price level, followed by a decline. This pattern indicates a strong resistance level that the market may struggle to break, leading to a potential reversal in the price trend. If the S&P 500 fails to surpass this resistance level and starts to decline, it could confirm the double top pattern and signal a bearish market outlook.
Moreover, the rising wedge pattern in the S&P 500 is another crucial signal that suggests a potential market top. A rising wedge pattern is a technical chart pattern characterized by a contracting range between upward sloping trend lines. This pattern typically indicates a weakening of the uptrend and warns of a possible trend reversal in the near future. If the S&P 500 price continues to trade within the confines of the rising wedge pattern and breaks below the lower trend line, it could signal a bearish reversal and a subsequent decline in the market.
In addition to these technical indicators, external factors such as geopolitical tensions, economic data releases, and monetary policy decisions can also influence the market sentiment and contribute to a potential market top in the S&P 500. Investors should stay vigilant and closely monitor these developments to adapt their investment strategies accordingly.
In conclusion, the S&P 500 has been flashing major topping signals through various technical indicators such as bearish divergence in the RSI, a potential double top pattern, and a rising wedge pattern. These signals warn investors of a possible market top and a subsequent reversal in the price trend. By staying informed and vigilant, investors can navigate through potential market corrections and downturns, and make well-informed decisions to protect their portfolios.