


In the world of trading and technical analysis, patterns play a vital role in providing insights into potential market movements. One such pattern that has garnered attention recently is the bearish engulfing pattern. This pattern signifies a potential reversal in the market trend and is often closely watched by traders and investors alike.
What is the Bearish Engulfing Pattern?
The bearish engulfing pattern is a two-candlestick pattern that occurs at the top of an uptrend. It is formed when a large bearish candle completely engulfs the previous small bullish candle. This pattern suggests a shift in momentum from bullish to bearish, indicating that the buyers are losing control and sellers may be stepping in.
Interpreting the Bearish Engulfing Pattern for NVDA
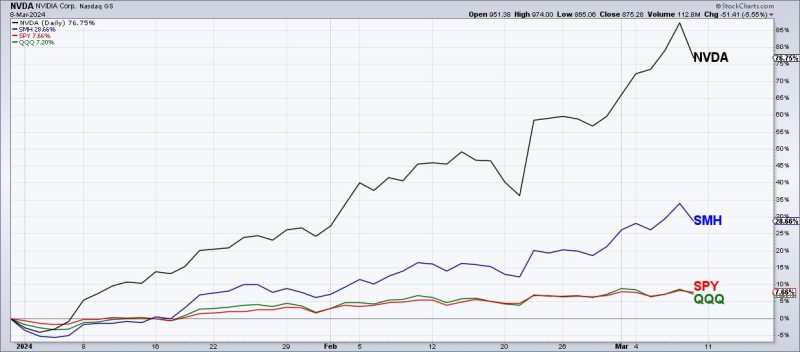
In the case of NVDA (NVIDIA Corporation), the bearish engulfing pattern has been identified as a potential signal that the stock may have topped out. As seen on the chart, a strong bullish trend was in place, with NVDA reaching new highs. However, the appearance of the bearish engulfing pattern could indicate a reversal in the trend.
The presence of the bearish engulfing pattern suggests that there was significant selling pressure following the previous bullish candle, leading to a sharp decline in prices. This could be a sign that the prevailing uptrend is losing steam and that a potential correction or reversal may be on the horizon for NVDA.
Trading Strategies for the Bearish Engulfing Pattern
For traders looking to capitalize on the bearish engulfing pattern, there are several strategies that can be employed. One common approach is to wait for confirmation of the pattern by observing the following candlestick. A strong bearish candle following the bearish engulfing pattern could serve as confirmation of a potential trend reversal.
Another strategy is to set stop-loss orders above the high of the bearish engulfing candle to manage risk in case the pattern does not play out as expected. Traders may also look for other technical indicators or chart patterns to validate their analysis and strengthen their trading decision.
Conclusion
In conclusion, the bearish engulfing pattern is a powerful tool in technical analysis that can provide valuable insights into potential market reversals. For NVDA and other stocks exhibiting this pattern, traders and investors should exercise caution and consider implementing appropriate risk management strategies. By understanding and interpreting the bearish engulfing pattern, traders can enhance their decision-making process and potentially profit from market downturns.